Telemetry for Python Web Apps: A Comprehensive Guide
Introduction
Have you ever deployed a Python web application only to face mysterious performance issues or crashes that you can’t reproduce locally? Without proper telemetry, debugging production systems becomes a frustrating game of guesswork. Modern Python applications—whether they’re Flask APIs, Django backends, or FastAPI microservices—generate thousands of requests daily, and understanding their behavior requires visibility into what’s actually happening.
Telemetry is the practice of collecting, processing, and analyzing data about your application’s performance and behavior. In this guide, you’ll learn how to implement comprehensive telemetry in Python web applications using OpenTelemetry, the industry-standard framework. We’ll cover automatic instrumentation that gets you started in minutes, manual instrumentation for custom insights, and production deployment patterns that scale. By the end, you’ll be able to track request flows, identify performance bottlenecks, and troubleshoot issues with confidence.
Prerequisites
Before diving into implementation, ensure you have:
- Python 3.9 or higher installed
- Basic understanding of Python web frameworks (Flask, Django, or FastAPI)
- Familiarity with HTTP requests and API concepts
- Access to an observability backend (we’ll use console output for examples, but production requires a backend like SigNoz, Grafana, or Jaeger)
- Docker installed (optional, for running OpenTelemetry Collector)
Understanding Telemetry Signals
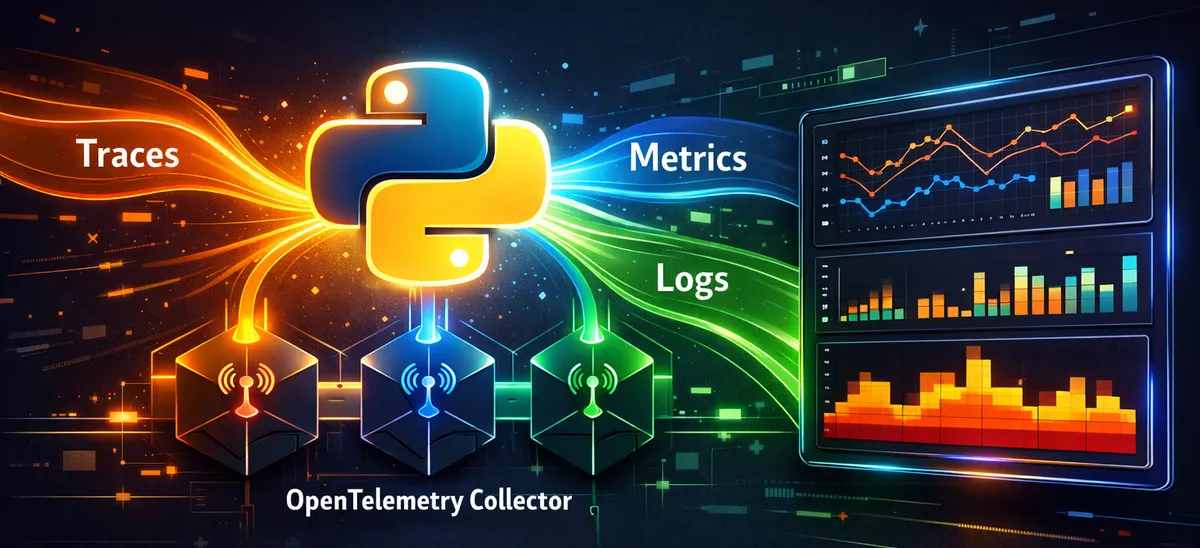
Telemetry encompasses three primary types of data that work together to give you complete application visibility:
Traces represent the journey of a request through your system. Each trace contains spans—individual units of work like database queries, HTTP calls, or function executions. Traces answer “what happened and in what order?”
Metrics are numerical measurements collected over time: request counts, response times, error rates, and resource utilization. They answer “how much and how often?”
Logs are timestamped event records with varying severity levels. They provide detailed context about specific events and answer “what was the system doing when X occurred?”
OpenTelemetry unifies all three signals under one framework, automatically correlating them so you can jump from a slow request trace directly to relevant logs, or from high error rates in metrics to the specific traces causing problems.
Setting Up OpenTelemetry for Python
OpenTelemetry provides two approaches: automatic instrumentation with zero code changes, and manual instrumentation for custom telemetry. We’ll start with the automatic approach.
Installation
Install the core OpenTelemetry packages and distribution:
# Install OpenTelemetry distro with API, SDK, and tools
pip install opentelemetry-distro opentelemetry-exporter-otlp

# Bootstrap auto-instrumentation for installed packages
opentelemetry-bootstrap -a install
The opentelemetry-bootstrap command scans your environment and installs instrumentation libraries for frameworks it detects—Flask, Django, FastAPI, requests, SQLAlchemy, and more.
Quick Start with Flask
Let’s instrument a simple Flask application. Create app.py:
# app.py - Flask 3.0+ compatible
from random import randint
from flask import Flask, request
import logging

app = Flask(__name__)
logging.basicConfig(level=logging.INFO)
logger = logging.getLogger(__name__)

@app.route("/rolldice")
def roll_dice():
    player = request.args.get('player', default='Anonymous', type=str)
    result = str(roll())
    logger.info(f"{player} rolled: {result}")
    return result

def roll():
    return randint(1, 6)

if __name__ == "__main__":
    app.run(port=8080)
Now run it with OpenTelemetry instrumentation:
# Enable logging auto-instrumentation
export OTEL_PYTHON_LOGGING_AUTO_INSTRUMENTATION_ENABLED=true

# Run with console exporters for development
opentelemetry-instrument \
    --traces_exporter console \
    --metrics_exporter console \
    --logs_exporter console \
    --service_name dice-server \
    python app.py
Visit http://localhost:8080/rolldice and watch your console fill with telemetry data. You’ll see spans tracking the HTTP request lifecycle, metrics about request counts and latencies, and your application logs enriched with trace IDs.
Automatic Instrumentation for Popular Frameworks
OpenTelemetry supports all major Python web frameworks with zero-code instrumentation.
FastAPI Applications
FastAPI, being ASGI-based, requires slightly different setup:
# fastapi_app.py
from fastapi import FastAPI
from random import randint

app = FastAPI()

@app.get("/")
async def root():
    return {"message": "Hello World"}

@app.get("/compute")
async def compute():
    result = sum(range(1000000))
    return {"result": result}
Run with instrumentation:
pip install opentelemetry-instrumentation-fastapi

opentelemetry-instrument \
    --traces_exporter console \
    --service_name fastapi-service \
    uvicorn fastapi_app:app --host 0.0.0.0 --port 8000
Django Projects
For Django applications, modify your manage.py or wsgi.py:
# manage.py additions
import os
import sys

# Add this before execute_from_command_line
from opentelemetry.instrumentation.django import DjangoInstrumentor
DjangoInstrumentor().instrument()

if __name__ == '__main__':
    os.environ.setdefault('DJANGO_SETTINGS_MODULE', 'myproject.settings')
    # ... rest of manage.py
Or use the automatic approach:
opentelemetry-instrument python manage.py runserverManual Instrumentation: Adding Custom Spans
Automatic instrumentation captures system boundaries, but you’ll want custom spans for business logic, complex computations, or external API calls.
Creating Custom Spans
Here’s how to add detailed tracing to your application:
# app_with_manual_instrumentation.py
from flask import Flask
from opentelemetry import trace
from random import randint, choice
import time

app = Flask(__name__)

# Get a tracer instance
tracer = trace.get_tracer(__name__)

@app.route("/process")
def process_request():
    # Automatic span created by Flask instrumentation
    # Add custom child span for business logic
    with tracer.start_as_current_span("process_business_logic") as span:
        span.set_attribute("user.type", "premium")

        # Simulate validation
        with tracer.start_as_current_span("validate_input"):
            is_valid = validate_data()
            span.set_attribute("validation.result", is_valid)

        # Simulate processing
        with tracer.start_as_current_span("complex_calculation"):
            result = perform_calculation()
            span.set_attribute("calculation.result", result)

        return {"status": "success", "result": result}

def validate_data():
    time.sleep(0.05)  # Simulate validation time
    return True

def perform_calculation():
    time.sleep(0.1)  # Simulate work
    return randint(100, 999)

if __name__ == "__main__":
    app.run(port=8080)
Adding Events and Attributes
Spans can be enriched with events and attributes for debugging:
from opentelemetry import trace

tracer = trace.get_tracer(__name__)

@app.route("/checkout")
def checkout():
    with tracer.start_as_current_span("checkout_process") as span:
        current_span = trace.get_current_span()

        # Add custom attributes
        current_span.set_attribute("cart.items", 5)
        current_span.set_attribute("cart.total", 129.99)
        current_span.set_attribute("user.id", "user_12345")

        # Add events for significant moments
        current_span.add_event("payment_initiated")

        try:
            process_payment()
            current_span.add_event("payment_successful")
        except Exception as e:
            current_span.add_event("payment_failed", {
                "error.message": str(e)
            })
            current_span.set_status(trace.Status(trace.StatusCode.ERROR))
            raise

        return {"status": "complete"}
Implementing Metrics Collection
While traces show individual request flows, metrics aggregate data over time for monitoring trends.
# metrics_example.py
from opentelemetry import metrics
from opentelemetry.sdk.metrics import MeterProvider
from opentelemetry.sdk.metrics.export import PeriodicExportingMetricReader, ConsoleMetricExporter

# Set up metrics provider
reader = PeriodicExportingMetricReader(ConsoleMetricExporter())
provider = MeterProvider(metric_readers=[reader])
metrics.set_meter_provider(provider)

# Get a meter instance
meter = metrics.get_meter(__name__)

# Create different metric types
request_counter = meter.create_counter(
    "requests_total",
    description="Total number of requests",
    unit="1"
)

active_requests = meter.create_up_down_counter(
    "active_requests",
    description="Number of requests currently being processed"
)

request_duration = meter.create_histogram(
    "request_duration_seconds",
    description="Request processing time",
    unit="s"
)

@app.route("/api/data")
def get_data():
    import time
    start = time.time()

    # Increment counters
    request_counter.add(1, {"endpoint": "/api/data", "method": "GET"})
    active_requests.add(1)

    try:
        # Process request
        time.sleep(0.1)
        result = {"data": "sample"}
        return result
    finally:
        # Record duration and decrement active requests
        duration = time.time() - start
        request_duration.record(duration, {"endpoint": "/api/data"})
        active_requests.add(-1)
Production Deployment with OpenTelemetry Collector
In production, you don’t want applications sending telemetry directly to backends. The OpenTelemetry Collector acts as a central pipeline for receiving, processing, and exporting telemetry.
Collector Configuration
Create a otel-collector-config.yaml:
# otel-collector-config.yaml
receivers:
  otlp:
    protocols:
      grpc:
        endpoint: 0.0.0.0:4317
      http:
        endpoint: 0.0.0.0:4318

processors:
  batch:
    timeout: 10s
    send_batch_size: 1024

  memory_limiter:
    check_interval: 1s
    limit_mib: 512

  # Remove sensitive data
  attributes:
    actions:
      - key: password
        action: delete
      - key: api_key
        action: delete

exporters:
  # Console exporter for debugging
  debug:
    verbosity: detailed

  # OTLP exporter to backend (e.g., Jaeger, Grafana, SigNoz)
  otlp:
    endpoint: "your-backend:4317"
    tls:
      insecure: false

service:
  pipelines:
    traces:
      receivers: [otlp]
      processors: [memory_limiter, batch, attributes]
      exporters: [debug, otlp]

    metrics:
      receivers: [otlp]
      processors: [memory_limiter, batch]
      exporters: [debug, otlp]

    logs:
      receivers: [otlp]
      processors: [memory_limiter, batch, attributes]
      exporters: [debug, otlp]
Running the Collector
# Using Docker
docker run -p 4317:4317 -p 4318:4318 \
  -v $(pwd)/otel-collector-config.yaml:/etc/otelcol/config.yaml \
  otel/opentelemetry-collector:latest
Configuring Your Application
Update your application to send telemetry to the collector:
# Set OTLP endpoint to collector
export OTEL_EXPORTER_OTLP_ENDPOINT="http://localhost:4318"
export OTEL_EXPORTER_OTLP_PROTOCOL="http/protobuf"
export OTEL_SERVICE_NAME="my-python-app"
export OTEL_RESOURCE_ATTRIBUTES="service.version=1.0.0,deployment.environment=production"

# Run your instrumented application
opentelemetry-instrument python app.py
Common Pitfalls and Troubleshooting
Issue 1: Missing Trace Data
Problem: Instrumentation installed but no traces appearing.
Solution: Check that instrumentation is loaded before your web framework imports:
# WRONG - Framework imported first
from flask import Flask
from opentelemetry.instrumentation.flask import FlaskInstrumentor

# CORRECT - Instrument before using framework
from opentelemetry.instrumentation.flask import FlaskInstrumentor
FlaskInstrumentor().instrument()
from flask import Flask
Or use opentelemetry-instrument CLI wrapper which handles initialization order automatically.
Issue 2: High Memory Usage
Problem: Application memory grows continuously.
Solution: Configure batch processors with appropriate limits:
from opentelemetry.sdk.trace import TracerProvider
from opentelemetry.sdk.trace.export import BatchSpanProcessor

provider = TracerProvider()

# Configure batching to reduce memory usage
span_processor = BatchSpanProcessor(
    exporter,
    max_queue_size=2048,
    max_export_batch_size=512,
    schedule_delay_millis=5000
)

provider.add_span_processor(span_processor)
Issue 3: Duplicate Telemetry in Forked Processes
Problem: When using Gunicorn or uWSGI with multiple workers, metrics are duplicated or broken.
Solution: For pre-fork servers, metrics export can be problematic. Use traces and logs primarily, or configure one worker for metrics:
# Single worker for development/testing
gunicorn -w 1 app:app

# For production, use the collector pattern
# Each worker sends to collector, which handles aggregation
Issue 4: Missing Database Query Details
Problem: Seeing HTTP traces but not database operations.
Solution: Install and enable database-specific instrumentation:
# For PostgreSQL with psycopg2
pip install opentelemetry-instrumentation-psycopg2

# For SQLAlchemy
pip install opentelemetry-instrumentation-sqlalchemy

# Re-run bootstrap
opentelemetry-bootstrap -a install
Issue 5: Cannot Connect to OTLP Endpoint
Problem: Failed to export spans or connection errors.
Solution: Verify endpoint configuration and network connectivity:
import logging
logging.basicConfig(level=logging.DEBUG)

# Check GRPC connectivity
export GRPC_VERBOSITY=debug
export GRPC_TRACE=http,call_error,connectivity_state
Ensure your endpoint uses the correct protocol (gRPC vs HTTP) and port:
- gRPC: typically port 4317
- HTTP: typically port 4318
Best Practices for Production
1. Use Sampling for High-Traffic Applications
Don’t trace every request at scale. Implement sampling:
from opentelemetry.sdk.trace import TracerProvider
from opentelemetry.sdk.trace.sampling import TraceIdRatioBased

# Sample 10% of traces
sampler = TraceIdRatioBased(0.1)
provider = TracerProvider(sampler=sampler)
2. Add Resource Attributes
Enrich telemetry with service metadata:
from opentelemetry.sdk.resources import Resource

resource = Resource.create({
    "service.name": "user-api",
    "service.version": "2.1.0",
    "deployment.environment": "production",
    "service.instance.id": os.getenv("HOSTNAME", "unknown")
})

provider = TracerProvider(resource=resource)
3. Handle Sensitive Data
Never log passwords, tokens, or PII:
from opentelemetry import trace

def process_user_data(user_email, password):
    with tracer.start_as_current_span("process_user") as span:
        # DO NOT do this
        # span.set_attribute("user.password", password)

        # DO this instead
        span.set_attribute("user.email_domain", user_email.split("@")[1])
        span.set_attribute("auth.method", "password")
Configure the collector to strip sensitive attributes as a safety net.
4. Monitor the Monitoring System
Your telemetry pipeline itself needs monitoring:
# Add self-telemetry in collector config
service:
  telemetry:
    logs:
      level: info
    metrics:
      address: :8888
5. Use Semantic Conventions
Follow OpenTelemetry semantic conventions for consistency:
# Use standard attribute names
span.set_attribute("http.method", "GET")
span.set_attribute("http.status_code", 200)
span.set_attribute("db.system", "postgresql")
span.set_attribute("db.statement", "SELECT * FROM users WHERE id = ?")
Conclusion
Implementing telemetry in Python web applications transforms debugging from guesswork into data-driven analysis. With OpenTelemetry, you can start with automatic instrumentation in minutes, then progressively add custom instrumentation for deeper insights. The three signals—traces, metrics, and logs—work together to give you complete visibility into application behavior.
Key takeaways: Start with automatic instrumentation for quick wins. Use the OpenTelemetry Collector in production for scalability and flexibility. Add custom spans around critical business logic. Follow sampling strategies for high-traffic services. Always handle sensitive data appropriately.
Next steps: Deploy a collector in your staging environment, experiment with different exporters and backends, and gradually instrument your most critical endpoints. For advanced topics, explore distributed tracing across microservices, custom metrics for business KPIs, and integration with alerting systems.
References:
- OpenTelemetry Python Documentation - https://opentelemetry.io/docs/languages/python/ - Official getting started guide, API reference, and instrumentation details
- OpenTelemetry Python SDK on GitHub - https://github.com/open-telemetry/opentelemetry-python - Source code, releases, and issue tracker for Python implementation
- Getting Started with OpenTelemetry and Python (SigNoz) - https://signoz.io/opentelemetry/python/ - Practical tutorial with backend setup and visualization examples
- OpenTelemetry Python Best Practices (Coralogix) - https://coralogix.com/guides/opentelemetry/opentelemetry-python-basics-tutorial-practices/ - Production patterns, exception tracking, and collector usage
- Deploying OpenTelemetry at Scale (Last9) - https://last9.io/guides/opentelemetry/deploying-opentelemetry-at-scale-production-patterns-that-work/ - Production deployment patterns and configuration management