Debugging Performance Bottlenecks in Web Applications
Introduction
Your users are complaining that your web application feels sluggish. Pages load slowly, interactions feel janky, and occasionally the browser tab crashes. Sound familiar? Performance bottlenecks are one of the most frustrating challenges in web development because they’re often invisible during development but painfully obvious to users in production.
The problem is that performance issues can originate from anywhere in your stack: inefficient JavaScript, unoptimized database queries, render-blocking resources, memory leaks, or network latency. Without a systematic approach, you’ll waste hours chasing symptoms instead of fixing root causes.
In this comprehensive guide, you’ll learn how to methodically identify and debug performance bottlenecks across your entire application stack. We’ll cover browser-based profiling tools, backend diagnostics, database optimization, and real-world troubleshooting strategies that actually work in production environments.
Prerequisites
Before diving into performance debugging, you should have:
- Basic understanding of web application architecture (frontend, backend, database)
- Familiarity with browser Developer Tools (Chrome DevTools preferred)
- Knowledge of JavaScript and at least one backend language
- A web application experiencing performance issues (or access to one for testing)
- Chrome browser (version 120+) installed for following along with examples
Understanding Performance Bottlenecks
A performance bottleneck occurs when one component in your application architecture restricts the entire system’s performance. Think of it as traffic congestion on a highway—even if most lanes are clear, a single blocked lane slows everyone down.
Performance bottlenecks typically manifest in several ways:
User-Visible Symptoms:
- Pages take 3+ seconds to load when they should load in under 1 second
- Interactions feel delayed or unresponsive
- Scrolling appears jerky or stutters
- Application crashes or freezes after extended use
Technical Indicators:
- High CPU or memory usage in browser or server
- Slow database query response times
- Large bundle sizes or excessive network requests
- Frequent garbage collection pauses
The key to effective debugging is understanding that bottlenecks exist across multiple layers. A slow page load might be caused by inefficient JavaScript on the frontend, but it could also stem from a database query returning too much data on the backend.
Frontend Performance Debugging with Chrome DevTools
Chrome DevTools is your primary weapon for identifying frontend bottlenecks. The Performance panel provides deep visibility into what your application is doing during page load and runtime.
Recording a Performance Profile
Open Chrome DevTools (F12), navigate to the Performance tab, and follow this workflow:
- Start Clean: Click the trash icon to force garbage collection before recording
- Record: Click the record button (red circle)
- Reproduce the Issue: Navigate, scroll, or interact with your app as a user would
- Stop Recording: Click stop after 5-10 seconds of interaction
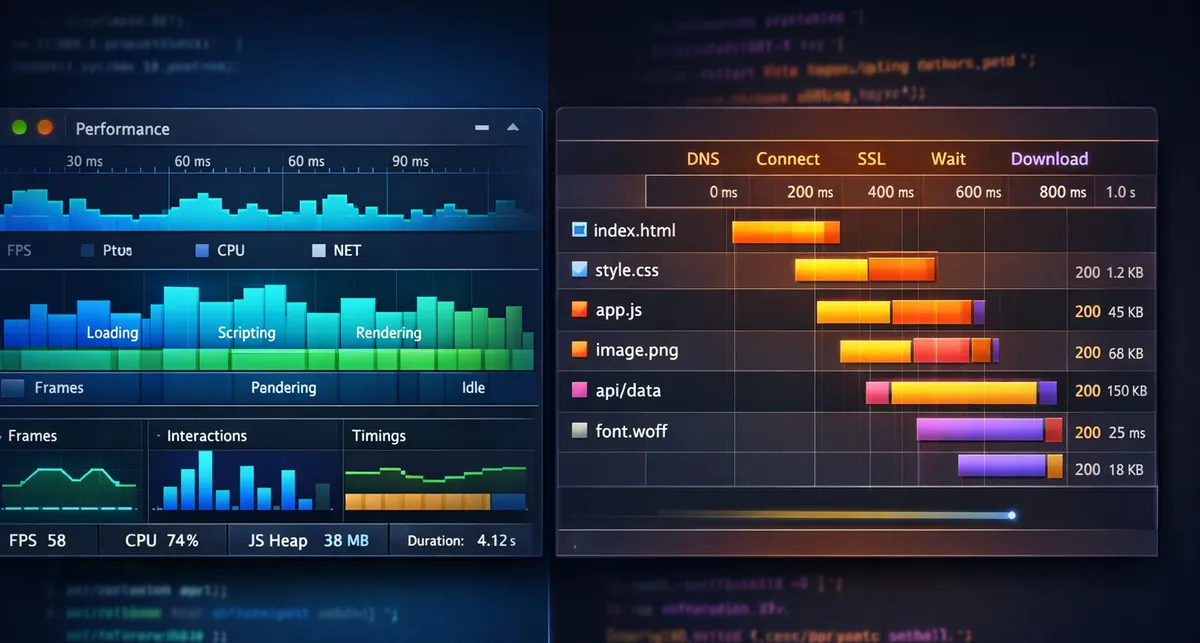
The timeline you’ll see shows several tracks:
Key Metrics to Monitor:
- FPS (Frames Per Second): Green bars indicate smooth 60fps; red bars show frame drops below 30fps
- CPU Usage: Different colors represent different activities (yellow = JavaScript, purple = rendering)
- Main Thread: Shows what your JavaScript and browser are doing over time
// Example: Identifying long-running JavaScript tasks
// BAD: Blocking the main thread with heavy computation
function processLargeDataset(data) {
  const results = [];
  for (let i = 0; i < 1000000; i++) {
    results.push(expensiveCalculation(data[i]));
  }
  return results;
}

// GOOD: Breaking work into chunks with requestIdleCallback
function processLargeDatasetAsync(data) {
  const results = [];
  let currentIndex = 0;
  const chunkSize = 1000;

  function processChunk(deadline) {
    while (currentIndex < data.length &&
           (deadline.timeRemaining() > 0 || deadline.didTimeout)) {
      results.push(expensiveCalculation(data[currentIndex]));
      currentIndex++;

      if (currentIndex % chunkSize === 0) {
        // Break to allow rendering
        if (currentIndex < data.length) {
          requestIdleCallback(processChunk);
        }
        return;
      }
    }

    if (currentIndex < data.length) {
      requestIdleCallback(processChunk);
    }
  }

  requestIdleCallback(processChunk);
}
Analyzing the Flame Chart
The Main thread section shows a flame chart—a hierarchical view of function calls. Functions at the top are children of functions below them.
Red flags to look for:
- Long Tasks: Any task exceeding 50ms (shown with red triangles in Chrome)
- Repeated Patterns: Multiple calls to the same function suggest optimization opportunities
- Layout Thrashing: Alternating read/write operations that force layout recalculations
When you identify a problematic function, click on it to see details including:
- Self time (time spent in that function alone)
- Total time (time including all child function calls)
- Source file location
Using Lighthouse for Quick Audits
Lighthouse provides automated performance audits that identify common issues. Run it directly from the Lighthouse tab in DevTools:
# Or via CLI for CI/CD integration
npm install -g lighthouse
lighthouse https://your-app.com --view --preset=desktop
Lighthouse will provide actionable recommendations such as:
- Eliminate render-blocking resources
- Reduce unused JavaScript
- Properly size images
- Minimize main-thread work
As of 2024, Chrome has integrated many Lighthouse features directly into the Performance panel, providing “Performance Insights” that combine timeline data with automated recommendations.
Network Performance Analysis
Network issues are often mistaken for frontend performance problems. The Network tab in DevTools reveals what’s actually happening.
Key Network Metrics
Monitor these critical measurements:
Time to First Byte (TTFB): Time until the first byte arrives from the server. Should be under 200ms for most applications.
Resource Load Times: Large JavaScript bundles or images taking seconds to download indicate optimization opportunities.
Waterfall Analysis: Sequential loading instead of parallel loading wastes time.
// Example: Optimizing resource loading with preload and prefetch
<!DOCTYPE html>
<html>
<head>
  <!-- Preload critical resources that will be needed immediately -->
  <link rel="preload" href="/critical-style.css" as="style">
  <link rel="preload" href="/critical-font.woff2" as="font" crossorigin>

  <!-- Prefetch resources that might be needed for next navigation -->
  <link rel="prefetch" href="/next-page-data.json">

  <!-- Use modern formats with fallbacks -->
  <link rel="stylesheet" href="/critical-style.css">
</head>
<body>
  <!-- Defer non-critical JavaScript -->
  <script src="/analytics.js" defer></script>
  <script src="/app-bundle.js" type="module"></script>
</body>
</html>
Identifying the N+1 Query Problem
One of the most common backend performance issues is the N+1 query problem, where your frontend triggers excessive API calls.
Watch for patterns like:
- Initial request fetches 100 items
- Then 100 individual requests fetch details for each item
- Total: 101 requests instead of 1 or 2
// BAD: N+1 problem in frontend
async function displayUserPosts() {
  const users = await fetch('/api/users').then(r => r.json());

  for (const user of users) {
    // This makes N additional requests!
    const posts = await fetch(`/api/users/${user.id}/posts`).then(r => r.json());
    renderUserPosts(user, posts);
  }
}

// GOOD: Fetch all data efficiently
async function displayUserPosts() {
  // Option 1: Single endpoint that returns everything
  const usersWithPosts = await fetch('/api/users?include=posts').then(r => r.json());

  usersWithPosts.forEach(user => {
    renderUserPosts(user, user.posts);
  });

  // Option 2: Batch request
  const users = await fetch('/api/users').then(r => r.json());
  const userIds = users.map(u => u.id);
  const allPosts = await fetch(`/api/posts?user_ids=${userIds.join(',')}`).then(r => r.json());

  const postsByUser = groupBy(allPosts, 'userId');
  users.forEach(user => {
    renderUserPosts(user, postsByUser[user.id] || []);
  });
}
Database Performance Optimization
Backend performance bottlenecks often trace back to inefficient database queries. Even if your application code is fast, slow database operations will cripple performance.
Identifying Slow Queries
Most database systems provide query logging. Enable slow query logs to capture problematic queries:
-- PostgreSQL: Enable slow query logging
ALTER SYSTEM SET log_min_duration_statement = 100; -- Log queries taking > 100ms
SELECT pg_reload_conf();

-- View slow queries
SELECT query, calls, total_time, mean_time
FROM pg_stat_statements
ORDER BY mean_time DESC
LIMIT 10;
Understanding the N+1 Problem in ORMs
Object-Relational Mappers (ORMs) can inadvertently create N+1 query problems. Here’s how it manifests:
// Example with Sequelize (Node.js)
// BAD: N+1 queries
const users = await User.findAll(); // 1 query
for (const user of users) {
  console.log(user.name);
  console.log(user.posts); // N queries - one per user!
}

// GOOD: Eager loading with include
const users = await User.findAll({
  include: [{
    model: Post,
    as: 'posts'
  }]
}); // Single query with JOIN

for (const user of users) {
  console.log(user.name);
  console.log(user.posts); // No additional query!
}
# Example with Django ORM
# BAD: N+1 queries
users = User.objects.all() # 1 query
for user in users:
print(user.name)
print(user.posts.all()) # N queries!
# GOOD: select_related for foreign keys
users = User.objects.select_related('profile').all()
# GOOD: prefetch_related for many-to-many or reverse foreign keys
users = User.objects.prefetch_related('posts').all()
for user in users:
print(user.name)
print(user.posts.all()) # No additional query!Using EXPLAIN to Analyze Queries
The EXPLAIN command shows how your database executes a query:
-- PostgreSQL EXPLAIN ANALYZE example
EXPLAIN ANALYZE
SELECT u.name, COUNT(p.id) as post_count
FROM users u
LEFT JOIN posts p ON u.id = p.user_id
WHERE u.created_at > '2024-01-01'
GROUP BY u.id, u.name
ORDER BY post_count DESC
LIMIT 10;

-- Look for these red flags in output:
-- 1. "Seq Scan" on large tables (missing index)
-- 2. High "cost" numbers
-- 3. "rows" estimate far from actual rows
-- 4. Multiple nested loops with high iteration counts
Common fixes based on EXPLAIN output:
-- Add index for frequently filtered columns
CREATE INDEX idx_users_created_at ON users(created_at);

-- Composite index for multi-column filters/sorts
CREATE INDEX idx_posts_user_created ON posts(user_id, created_at DESC);

-- Covering index to avoid table lookups
CREATE INDEX idx_users_email_name ON users(email) INCLUDE (name);
Memory Leak Detection and Resolution
Memory leaks cause applications to slow down over time and eventually crash. They’re particularly insidious because they often don’t manifest immediately.
Symptoms of Memory Leaks
- Application becomes progressively slower during a single session
- Browser tab eventually crashes or becomes unresponsive
- Memory usage graph shows continuous upward trend without plateauing
Using the Memory Profiler
Chrome DevTools Memory panel offers three tools:
- Heap Snapshot: Capture current memory state
- Allocation Timeline: Record memory allocations over time
- Allocation Sampling: Low-overhead profiling of memory allocation by function
Workflow for identifying leaks:
// Example memory leak: Detached DOM nodes
class TodoList {
  constructor() {
    this.items = [];
    this.container = document.getElementById('todo-list');
  }

  // BAD: Creates memory leak
  addItem(text) {
    const item = document.createElement('li');
    item.textContent = text;
    this.container.appendChild(item);
    this.items.push(item); // Storing DOM reference
  }

  clear() {
    this.container.innerHTML = ''; // DOM nodes removed
    // But this.items still holds references - memory leak!
  }
}

// GOOD: Properly clean up references
class TodoList {
  constructor() {
    this.container = document.getElementById('todo-list');
  }

  addItem(text) {
    const item = document.createElement('li');
    item.textContent = text;
    this.container.appendChild(item);
    // Don't store DOM references unnecessarily
  }

  clear() {
    this.container.innerHTML = '';
    // No references to clean up
  }
}
Common Memory Leak Patterns
// 1. Event Listeners Not Removed
// BAD
class Component {
  init() {
    this.handler = () => this.handleClick();
    document.addEventListener('click', this.handler);
  }
  // destroy() method missing - listener never removed!
}

// GOOD
class Component {
  init() {
    this.handler = () => this.handleClick();
    document.addEventListener('click', this.handler);
  }

  destroy() {
    document.removeEventListener('click', this.handler);
    this.handler = null;
  }
}

// 2. Forgotten Timers/Intervals
// BAD
class DataPoller {
  start() {
    setInterval(() => {
      this.fetchData();
    }, 5000);
  }
}

// GOOD
class DataPoller {
  start() {
    this.intervalId = setInterval(() => {
      this.fetchData();
    }, 5000);
  }

  stop() {
    clearInterval(this.intervalId);
    this.intervalId = null;
  }
}

// 3. Closures Holding Large Objects
// BAD
function createHandler(largeData) {
  return function() {
    // Handler holds reference to largeData even if not used
    console.log('Handler called');
  };
}

// GOOD
function createHandler(largeData) {
  const requiredValue = largeData.smallProperty;
  return function() {
    // Only holds reference to small value
    console.log('Handler called with', requiredValue);
  };
}
Taking and Comparing Heap Snapshots
- Take snapshot before performing an action
- Perform the action (e.g., open/close a modal 3 times)
- Force garbage collection (trash icon)
- Take second snapshot
- Compare snapshots looking for objects that should have been cleaned up
Filter for detached DOM nodes or look at the “Comparison” view to see what increased between snapshots.
Real User Monitoring (RUM) for Production Insights
Browser DevTools are perfect for debugging in development, but you need Real User Monitoring to understand performance in production across diverse devices, networks, and user behaviors.
Why RUM Matters
Synthetic testing (like Lighthouse) runs in controlled conditions. RUM captures actual user experiences:
- Real network conditions (not simulated throttling)
- Actual device capabilities (not just desktop)
- Geographic distribution
- Browser variations and extensions
Implementing Basic RUM
Modern browsers provide the Performance API for collecting metrics:
// Collect Core Web Vitals
function reportWebVitals() {
  // Largest Contentful Paint (LCP)
  new PerformanceObserver((list) => {
    const entries = list.getEntries();
    const lastEntry = entries[entries.length - 1];
    sendMetric('LCP', lastEntry.renderTime || lastEntry.loadTime);
  }).observe({ entryTypes: ['largest-contentful-paint'] });

  // First Input Delay (FID) / Interaction to Next Paint (INP)
  new PerformanceObserver((list) => {
    list.getEntries().forEach((entry) => {
      const delay = entry.processingStart - entry.startTime;
      sendMetric('FID', delay);
    });
  }).observe({ entryTypes: ['first-input'] });

  // Cumulative Layout Shift (CLS)
  let clsScore = 0;
  new PerformanceObserver((list) => {
    list.getEntries().forEach((entry) => {
      if (!entry.hadRecentInput) {
        clsScore += entry.value;
      }
    });
    sendMetric('CLS', clsScore);
  }).observe({ entryTypes: ['layout-shift'] });

  // Navigation Timing
  window.addEventListener('load', () => {
    const perfData = performance.getEntriesByType('navigation')[0];
    sendMetric('TTFB', perfData.responseStart - perfData.requestStart);
    sendMetric('DOMContentLoaded', perfData.domContentLoadedEventEnd - perfData.fetchStart);
    sendMetric('LoadComplete', perfData.loadEventEnd - perfData.fetchStart);
  });
}

function sendMetric(name, value) {
  // Send to your analytics endpoint
  navigator.sendBeacon('/analytics', JSON.stringify({
    metric: name,
    value: value,
    url: window.location.href,
    timestamp: Date.now()
  }));
}

// Initialize monitoring
if (document.readyState === 'complete') {
  reportWebVitals();
} else {
  window.addEventListener('load', reportWebVitals);
}
Popular RUM Tools
For production applications, consider these platforms:
Open Source:
- OpenObserve: Self-hosted RUM with session replay capabilities
- Sentry: Error tracking with performance monitoring (generous free tier)
Commercial:
- Datadog RUM: Enterprise-grade with APM integration ($1.50-2.60 per 1,000 sessions)
- New Relic: Unified frontend/backend monitoring (starts at $10/user/month)
- SpeedCurve: Combines RUM with synthetic monitoring for web performance teams
Application Performance Monitoring (APM) for Backend
While frontend tools show what users experience, APM tools reveal what’s happening on your servers.
What APM Tools Provide
- Transaction Tracing: Follow a request through your entire stack
- Database Query Monitoring: Identify slow queries automatically
- Distributed Tracing: Track requests across microservices
- Error Tracking: Correlate errors with performance degradation
Instrumenting Your Application
Most APM tools require minimal code changes:
// Example: New Relic instrumentation (Node.js)
// Add at the very top of your main file
require('newrelic');

// That's it! Auto-instrumentation handles the rest

// For custom transactions:
const newrelic = require('newrelic');

async function processOrder(orderId) {
  return newrelic.startBackgroundTransaction('processOrder', async function() {
    const order = await db.getOrder(orderId);
    await paymentService.charge(order);
    await emailService.sendConfirmation(order);
    return order;
  });
}
# Example: Datadog APM (Python/Flask)
from ddtrace import patch_all
patch_all()
from flask import Flask
app = Flask(__name__)
# Custom instrumentation
from ddtrace import tracer
@app.route('/api/users/<user_id>')
def get_user(user_id):
with tracer.trace('database.query', service='postgres'):
user = db.query(User).get(user_id)
with tracer.trace('api.external', service='recommendations'):
recommendations = fetch_recommendations(user_id)
return jsonify({'user': user, 'recommendations': recommendations})Common Pitfalls and Troubleshooting
Render-Blocking Resources
Problem: CSS and JavaScript in <head> blocks page rendering.
Solution:
<!-- BAD -->
<head>
  <link rel="stylesheet" href="styles.css">
  <script src="app.js"></script>
</head>

<!-- GOOD -->
<head>
  <!-- Critical CSS inline -->
  <style>
    /* Above-the-fold styles */
  </style>
  <!-- Non-critical CSS loaded async -->
  <link rel="preload" href="styles.css" as="style" onload="this.onload=null;this.rel='stylesheet'">
  <noscript><link rel="stylesheet" href="styles.css"></noscript>
</head>
<body>
  <!-- JavaScript at end with defer/async -->
  <script src="app.js" defer></script>
</body>
Excessive Re-renders in React
Problem: Components re-render unnecessarily, causing jank.
// BAD: New object on every render
function UserList() {
  const [users, setUsers] = useState([]);

  // This creates new object on every render!
  const config = { sortBy: 'name', order: 'asc' };

  return <Table data={users} config={config} />;
}

// GOOD: Memoize object
function UserList() {
  const [users, setUsers] = useState([]);

  const config = useMemo(() =>
    ({ sortBy: 'name', order: 'asc' }),
    []
  );

  return <Table data={users} config={config} />;
}

// BETTER: Memoize expensive child components
const Table = React.memo(({ data, config }) => {
  // Only re-renders if data or config actually changes
  return <table>...</table>;
});
Database Connection Pool Exhaustion
Problem: Application runs out of database connections under load.
// BAD: Creating new connection per request
app.get('/users', async (req, res) => {
  const db = await connectToDatabase(); // New connection!
  const users = await db.query('SELECT * FROM users');
  await db.close();
  res.json(users);
});

// GOOD: Use connection pooling
const pool = new Pool({
  max: 20, // Maximum pool size
  min: 5,  // Minimum pool size
  idleTimeoutMillis: 30000,
});

app.get('/users', async (req, res) => {
  const client = await pool.connect();
  try {
    const result = await client.query('SELECT * FROM users');
    res.json(result.rows);
  } finally {
    client.release(); // Return to pool, don't close
  }
});
Images Not Optimized
Problem: Serving full-resolution images to all devices.
<!-- BAD -->
<img src="hero-image.jpg" alt="Hero">

<!-- GOOD: Responsive images with modern formats -->
<picture>
  <source
    type="image/avif"
    srcset="hero-400.avif 400w,
            hero-800.avif 800w,
            hero-1200.avif 1200w"
    sizes="(max-width: 600px) 400px,
           (max-width: 1200px) 800px,
           1200px">
  <source
    type="image/webp"
    srcset="hero-400.webp 400w,
            hero-800.webp 800w,
            hero-1200.webp 1200w"
    sizes="(max-width: 600px) 400px,
           (max-width: 1200px) 800px,
           1200px">
  <img
    src="hero-800.jpg"
    srcset="hero-400.jpg 400w,
            hero-800.jpg 800w,
            hero-1200.jpg 1200w"
    sizes="(max-width: 600px) 400px,
           (max-width: 1200px) 800px,
           1200px"
    alt="Hero"
    loading="lazy">
</picture>
Conclusion
Debugging performance bottlenecks requires a systematic, layer-by-layer approach. Start by identifying which layer is causing the issue (frontend, network, backend, or database), then use the appropriate tools to drill down into the root cause.
Key takeaways:
- Use Chrome DevTools Performance panel for frontend profiling
- Monitor network requests to catch excessive API calls and the N+1 problem
- Enable database query logging and use EXPLAIN to optimize slow queries
- Watch for memory leaks using heap snapshots and proper cleanup patterns
- Implement Real User Monitoring to understand production performance
- Use APM tools to trace requests through your backend stack
Performance optimization is an ongoing process, not a one-time fix. Set up monitoring, establish performance budgets, and integrate performance testing into your CI/CD pipeline. The tools and techniques covered here will help you catch issues before they reach production and debug them quickly when they do.
Next steps:
- Install Chrome DevTools and profile your application today
- Set up basic RUM to track Core Web Vitals in production
- Review your database queries for N+1 problems and missing indexes
- Audit your frontend code for common memory leak patterns
References:
- Chrome DevTools Performance Documentation - https://developer.chrome.com/docs/devtools/performance - Comprehensive guide to Chrome’s performance profiling features and best practices for 2024-2025
- Debugging Performance Bottlenecks in Web Apps - https://blog.pixelfreestudio.com/debugging-performance-bottlenecks-in-web-apps/ - Practical walkthrough of identifying JavaScript bottlenecks and using the Performance panel effectively
- Performance Bottlenecks: What Is It & How To Avoid - https://pflb.us/blog/performance-bottlenecks/ - Overview of different bottleneck types across CPU, memory, disk I/O, and network layers with identification strategies
- N+1 Query Problem Solutions - https://readyset.io/blog/investigating-and-optimizing-over-querying - In-depth analysis of the N+1 query problem with database-specific solutions and APM tool recommendations
- Fix Memory Problems - Chrome DevTools - https://developer.chrome.com/docs/devtools/memory-problems - Official Chrome documentation on using heap snapshots and allocation timelines to identify memory leaks
- Best Frontend Performance Monitoring Tools 2025 - https://cssauthor.com/best-frontend-performance-monitoring-tools/ - Comprehensive comparison of RUM tools including Datadog, New Relic, Sentry, and Splunk with pricing as of 2024-2025
- Web Performance Best Practices in 2025 - https://dev.to/service_maxsell_64ece3f66/web-performance-best-practices-in-2025-a-developers-guide-376g - Current trends including Core Web Vitals updates, AI-assisted monitoring, and modern optimization techniques